Disciplinary Events
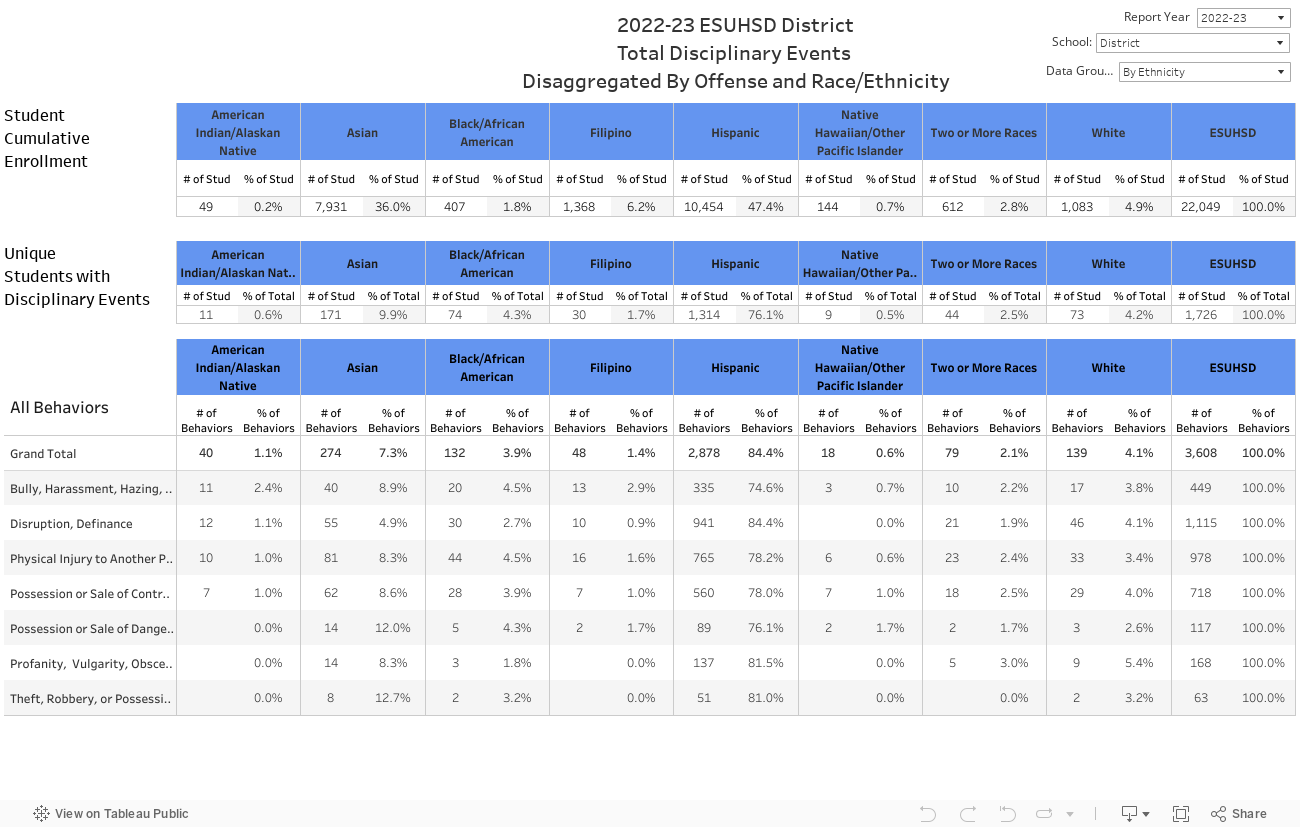
The table below shows the total number of student behavioral referrals for the entire school year by discipline category and student demographics. The cumulative student enrollment disaggregated by student demographics is displayed at the top for reference showing the size of these populations within schools and the district. Student Behavior data is not displayed for student populations with a size less than 10. However, these behavior incidents are included in school wide or district wide data.
The Disciplinary Events table should be read across looking at a single category to understand the demographic breakdown of the students within the disciplinary category. For example, if you look at the row for Disruption, Defiance, each cell shows the number of students referred and the percentage that category makes up of the Disruption, Defiance category. An example may show there were 29 Filipino students within Disruption, Defiance referrals and these 29 students make up 1.2% of all Disruption, Defiance behavioral referrals.
Things to consider when viewing student discipline data:
- The District’s student discipline data is a reflection of the district's practices and not a reflection on any student group.
- Be cognizant of your own biases when viewing data.
- Look at the demographics data first to you understand the population sizes represented in the data.
- Be aware that small student populations can cause large fluctuations in numbers and create large percentages for a small number of students.
- Use your mouse to roll over graphs and percents to see more detail.
Viewing Hint: If the menu on the right interferes with the graph or table click on the “-” next to options to shorten the menu.