Disproportionality
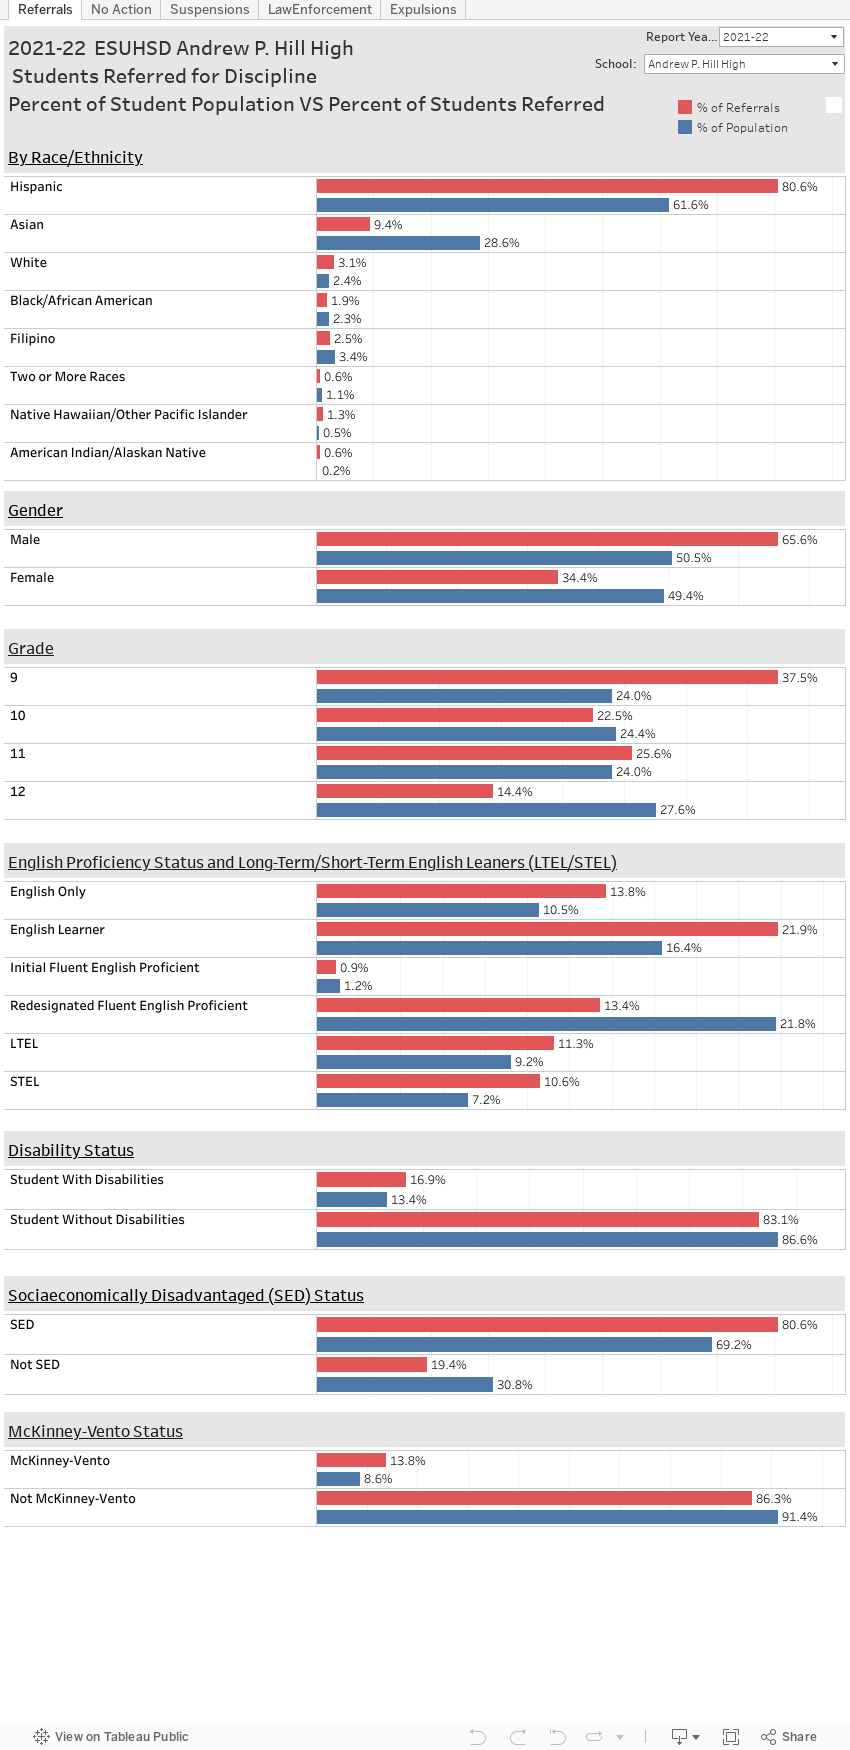
The graph below shows the percentage a student group represents in the whole East Side Union High School District Population and the percentage that same student group represents in the “students referred” or “Students Suspended” etc., population.
Using the graphs for student behavior referrals as an example, the blue bars show the percentage a student population represents in the ESUHSD population. The red bar shows the percentage that same student population represents among all students with behavior referrals. These graphs show whether a disproportionality exists for each student group. No disproportionality exists if the blue bar and red bar are the same size. If the red bar is longer than the blue bar then that means that that student group is overrepresented in student behavior referrals and a disproportionality exists. If the blue bar is longer than the red bar then that means that that student group is underrepresented in student behavior referrals and a disproportionality exists.
For example, if the red bar for Hispanic students shows that Hispanic students make up 71.2% of all students with behavior referrals and the blue bar for Hispanic students shows that Hispanic students make up 46.9% of the student population, then this shows that a disproportionate percentage of Hispanic students receive behavior referrals as compared to the percentage Hispanic students represent in the whole ESUHSD population.
View the disproportionality graphs for student suspensions, referral to law enforcement, no action or other means of corrections, and student expulsions by clicking on the tabs at the top.
Things to consider when viewing student discipline data:
- The District’s student discipline data is a reflection of the district's practices and not a reflection on any student group.
- Be cognizant of your own biases when viewing data.
- Look at the demographics data first to understand the population sizes represented in the data.
- Be aware that small student populations can cause large fluctuations in numbers and create large percentages for a small number of students.
- Use your mouse to roll over graphs and percents to see more detail.
Student Behavior data is not displayed for student populations with a size less than 10. However, these behavior incidents are included in school wide or district wide data.