Risk Factor Ratios
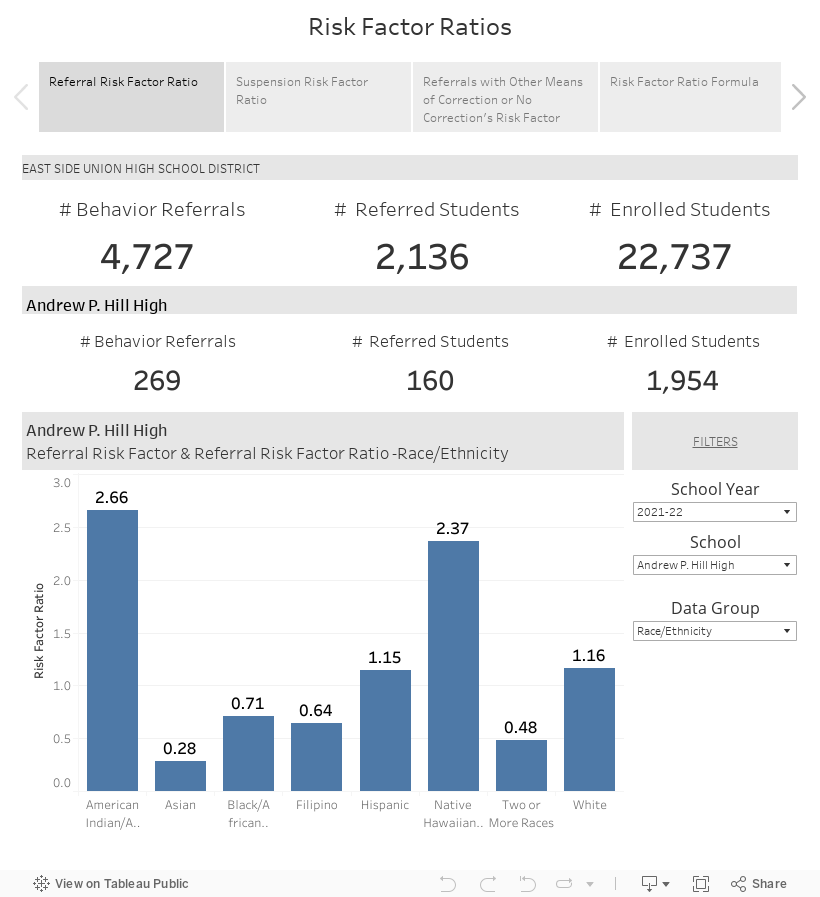
The graph below shows the risk factor ratio for student groups for either receiving a Behavior Referral, a Suspension, or a Behavior Referral with an outcome of No Action or Other Means of Correction. You can view the risk factor ratios for these different categories by clicking on the tabs at the top.
A risk factor ratio shows that X student group is Y times more likely than all other students to receive a behavior referral or suspension etc. For example if the risk factor ratio for Hispanic students for behavior referrals is 2.76 that is interpreted as; in East Side, Hispanic students are 2.76 times more likely to receive a behavior referral than all other students.
To view more information about risk factor ratios go to this website.
Things to consider when viewing student discipline data:
- The District’s student discipline data is a reflection of the district's practices and not a reflection on any student group.
- Be cognizant of your own biases when viewing data.
- Look at the demographics data first to understand the population sizes represented in the data.
- Be aware that small student populations can cause large fluctuations in numbers and create large percentages for a small number of students.
- Use your mouse to roll over graphs and percents to see more detail.
Student Behavior data is not displayed for student populations with a size less than 10. However, these behavior incidents are included in school wide or district wide data.