Student Behavior Referrals
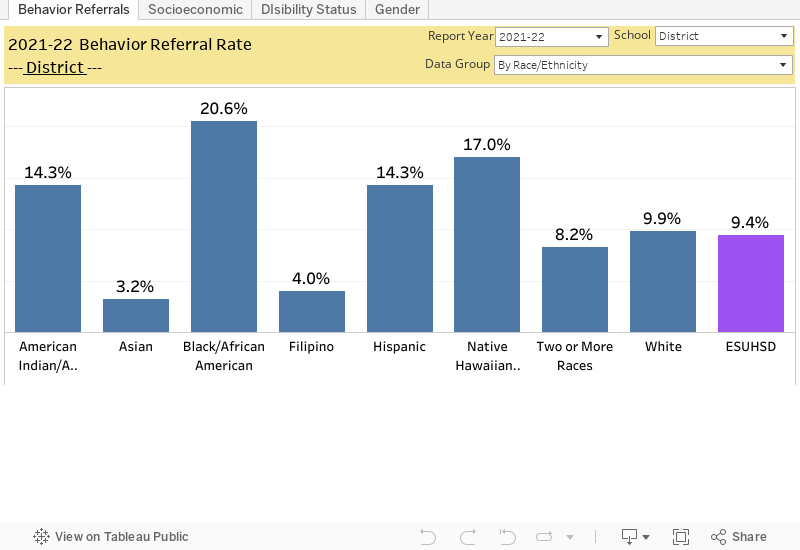
The graph below shows the student behavior referral rates disaggregated by student group. Rates depict the likelihood of East Side staff submitting a behavior referral for a student within a specific group. For example, the referral rate for ESUHSD might be 9.4% which could be interpreted as a student in East Side has a 9.4% chance of receiving a student behavior referral. The graph shows that East Side staff are more likely to refer certain students more than others. To look into this more in depth click on the link above for Risk Factor Ratios. To learn more about how referral rates are calculated click on the link above for Data Definitions.
Multiple Characteristics can be viewed using the Disability tab and Gender tab. If you click on Gender you will see the referral rates broken down for each race/ethnicity by gender. One thing to look for in these graphs is whether or not there is a gap between student groups within the same category. For example, when looking at Race/Ethnicity broken down by Socioeconomic status do you still see a disparity between student groups. i.e. is the referral rate for the African American Socioeconomically Disadvantaged student group higher than the White Socioeconomically Disadvantaged student group?
Things to consider when viewing student discipline data:
- The District’s student discipline data is a reflection of the district's practices and not a reflection on any student group.
- Be cognizant of your own biases when viewing data.
- Look at the demographics data first so you understand the population sizes represented in the data.
- Small student populations can cause large fluctuations in numbers and create large percentages for a small number of students.
- Use your mouse to roll over graphs and percents to see more detail.
Student Behavior data is not displayed for student populations with a size less than 10. However, these behavior incidents are included in school wide or district wide data.