Student Expulsions
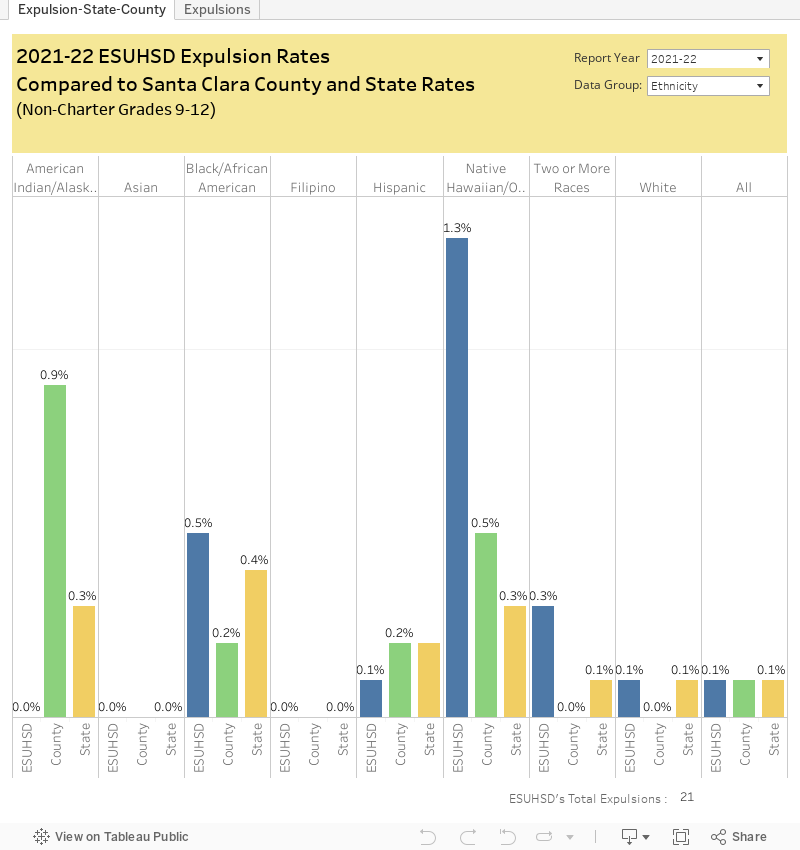
The graph and tables below show the student expulsion rates disaggregated by student group in comparison to the rates for Santa Clara County and the State of California. Rates depict the likelihood of East Side expelling a student within a specific group. For example, if the expulsion rate for ESUHSD is 0.1% this could be interpreted to mean that a student in East Side has a 0.1% chance of being expelled.
A breakdown of the characteristics of the students expelled during the calendar year can be viewed by clicking on the tab labeled “Expulsions” which also shows the student behaviors which resulted in an expulsion. To learn more about how expulsion rates are calculated click on the link above for Data Definitions. Data for expulsions is shown at the district level only because there were less than 10 student expulsions at any school.
Things to consider when viewing student discipline data:
- The District’s student discipline data is a reflection of the district's practices and not a reflection on any student group.
- Be cognizant of your own biases when viewing data.
- Look at the demographics data first to understand the population sizes represented in the data.
- Be aware that small student populations can cause large fluctuations in numbers and create large percentages for a small number of students.
- Use your mouse to roll over graphs and percents to see more detail.