Student Suspensions
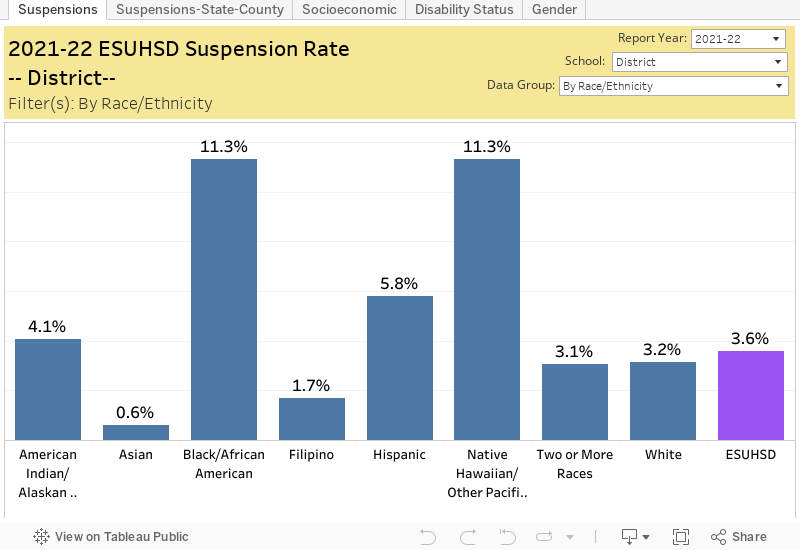
The graph below shows student suspension rates disaggregated by student group. Suspensions include both In-School and Out-of-School suspensions and In-School suspensions include suspensions from a class (teacher suspensions). Rates depict the likelihood of East Side staff suspending a student within a specific group. For example, if the suspension rate for ESUHSD is 3.6%, this could be interpreted to mean that a student in East Side has a 3.6% chance of being suspended. The graph shows that East Side staff are more likely to suspend certain students more than others. To look into this more in depth click on the link above for Risk Factor Ratios. To learn more about how suspension rates are calculated click on the link above for Data Definitions.
Multiple Characteristics can be viewed using the Disability tab and Gender tab. If you click on Gender you will see the suspension rates broken down for each race/ethnicity by gender.
Things to consider when viewing student discipline data:
- The District’s student discipline data is a reflection of the district's practices and not a reflection on any student group.
- Be cognizant of your own biases when viewing data.
- Look at the demographics data first to understand the population sizes represented in the data.
- Be aware that small student populations can cause large fluctuations in numbers and create large percentages for a small number of students.
- Use your mouse to roll over graphs and percents to see more detail.
Student Behavior data is not displayed for student populations with a size less than 10. However, these behavior incidents are included in school wide or district wide data.